PC board : 1.94 x 2.68 inches, DB15M connector for I/O
Specifications
Physical Dimensions :	1.94 x 2.68 inches ( less DB15 connector )
		     Designed to fit a Hammond model 1593Q enclosure
DC Input Power:	7-15 VDC
RSSI input :	+0.05 to +5.00 volts range ( more with external R's )
		     minimum RSSI change = 400 mV ( max - min ) for best results
		     Calib trimpots for RSSI bias and gain compensation
		     2 Megohms input Z
RS232 output :	9600 baud, 8N1
SquealTone output :	100 mW, ( adjustable ) 8 ohms
		     3 octave range, ( 0.2-1.6 KHz ) with log response to RSSI voltage
		     x5 sensitivity mode ( for portable operation only )
ENABLE Input :	user-provided ( required ) switch for RS232 reporting on / off
HEADING Input :	user-provided ( optional ) switch for antenna = 12 o'clock position
TACH Input :	user-provided ( optional ) tach clock to follow antenna rotation
Calib Trimpots :	RSSI bias coarse / fine adjust, bias = 0.05 to 5.00 volts
		     RSSI gain coarse / fine adjust, gain = x0 to x20
		     Trimpots are pre-adjusted ( if user provides RSSI info with order )
Calib LEDs :	MAX LED = on at 95% of max RSSI
		     MIN LED = on at 5% of max RSSI
Chips :		Microchip PIC 16C773 microcomputer
		     Microchip MCP6044 quad opamp
		     LM386 audio amp
		     78L05 voltage regulator
Schematics and Pictorials
PicoPlot Schematic 25K, gif.
PicoPlot Pictorial 42K, gif.
PicoPlot DB15 pinout 5K, gif.
PicoPlot Straps 18K, gif.
Install Connections
The figure below shows the external connections required to use the
PicoPlot DF. Some of the connections shown are optional, and depend on the mode of
operation selected by the user. ( There are 3 available DF modes and one SelfTest mode )

General Description
The PicoPlot is essentially an old-style "signal strength" type DF,
but with some modern technology added, to enhance the precision and performance of this DF method.
The PicoPlot DF accepts an analog RSSI or S-meter input signal, measures the signal with a
microcomputer, and sends the results to a display computer through an RS232 data link. An ENABLE
switch input is provided to enable / disable the RS232 reporting. Optional HEADING and TACH inputs
allow more sophisticated DF operation, with mast-mounted ( rotating ) antennas.
There are three operating DF modes, selected with wire straps on the PC board.
The Portable SteadyScan mode ( simpest ) is intended for portable DF operation. The Triggered SteadyScan
and TachScan modes are intended for mast-mounted ( mobile or fixed ) rotating antennas. The user
must provide a receiver with an RSSI or S-meter analog output, a display computer, and a directional
antenna of some kind.
Limited DF operation without a display computer is possible, using the SquealTone
audio output to drive a speaker. ( tone pitch follows the RSSI level ) An Irda output ( for an
infrared LED ) is also provided to drive a ( cordless ) "optical data link" to a PalmOS PDA
display, but at this time, ( June 2007 ) the PDA display program is not available. ( this output
is for future use )
Calibration trimpots are provided to compensate for DC bias and gain in the
RSSI signal, which will vary depending on the type of receiver employed. These trimpots need to
be adjusted only once, for a particular type of receiver. Calibration LEDs ( MAX and MIN ) are
provided to assist the calibration process. The process is not very critical, and no special
test equipment is required. The PicoPlot DF will be shipped with these trimpots "pre-adjusted" ( no charge ) if the user provides information about the maximum and minimum RSSI voltages, for the DF reciever that will be employed.
In normal use, the directional antenna must be rotated through a complete 360
degree turn to generate a polar plot display, using the ( free ) WinPlot IBM PC display program.
Multiple ( successive ) 360 sweeps ( if performed ) will update the display, automatically.
WinPlot can receive RSSI messages from one sweep while simultaneously analyzing and displaying
data from the previous sweep, so constant antenna rotation ( if desired ) is possible. ( for use with Triggered SteadyScan and TachScan modes )
SelfTest Mode
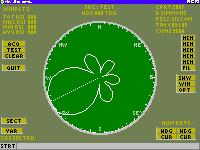
The PicoPlot DF has a built-in "test pattern" generator ( SelfTest mode )
that can be used to test the RS232, IrDA and SquealTone outputs. The image below shows the
RS232 test pattern, ( displayed with the WinPlot display program ) with 5 lobes and the major lobe at
a DF bearing of 245 degrees.
The pattern is transmitted constantly, ( about 3 seconds for each pattern )
while SelfTest is selected, ( both mode straps = open circuit ) and the ENABLE switch is
closed. Both of the calibration LEDs ( MAX and MIN ) are simultaneously turned "on", to
indicate SelfTest is in progress, and the SquealTone responds to the test pattern data.
RSSI Calibration
Details about the ( required ) RSSI calibration procedure are provided on
the PicoPlot COMPLETION INFO webpage, which is available HERE. The procedure is necessary
to ensure the RSSI signal measurement is performed with the best precision available from
the PicoPlot DF. The PicoPlot DF will be shipped with these trimpots "pre-adjusted" ( no charge ) if the user provides information about the maximum and minimum RSSI voltages, for the DF reciever that will be employed.
The RSSI signal must have a positive polarity and not exceed +5 VDC, although external resistors will allow higher RSSI voltages. To get full performance from the PicoPlot DF, the RSSI voltage should vary at least 400 millivolts from maximum signal strength to minimum signal strength. ( smaller values will work... )
The PicoPlot RSSI input presents a 2 Megohm load to the reciever RSSI output.
The analog RSSI voltage must be a positive voltage, but it can either
"ascend" or "descend" with increasing RSSI level. RSSI signals that ascend ( = more positive voltage )
with increasing RSSI levels exhibit a "positive coefficient". RSSI signals that descend
( = less positive voltage ) with increasing RSSI levels exhibit a "negative coefficient". A button
on the OPTIONS page of the WinPlot display program allows selection of either type of coefficient. The SquealTone output assumes the receiver has a positive co-efficient, but this can be changed by installing a ( crude ) "strap", ( a solder bridge ) between pins 22 and 23 on the PIC micro.
The calibration procedure ( if the user performs it ) is not really very critical, and two LEDs are provided
on the PicoPlot PC board, to assist the calibration process. The SquealTone output is also very useful for these adjustments. The calibration involves the adjustment
of 4 trimpots on the PC board, ( 2 coarse, 2 fine ) while
alternately providing "full scale" and "zero signal" RSSI levels to the PicoPlot DF.
The procedure needs to be performed only once, ( for a specific type of receiver ) to
compensate for RSSI DC bias and range values, which ( naturally ) will depend on the
specific type of receiver employed.
PicoPlot Operation
The PicoPlot DF has three operating modes, to allow flexibility
in the DF design. The modes are selected with two wire straps on the PC board. The SelfTest
mode ( if included ) yields a total of 4 modes. All modes can drive the WinPlot display
program, and all modes drive the SquealTone output.
Portable SteadyScan Mode
The simplest mode is the Portable SteadyScan mode, in which the
user closes a switch ( ENABLE input ) at the start of a 360 degree antenna scan,
holds the switch closed throughout the scan, and then opens the switch when the scan is completed. The antenna should be rotated at a constant
rate throughout the turn. ( a "steady scan" ) The switch should be closed and opened when
the antenna faces the same compass heading. ( closed = start, opened = end, result = 360
degrees ) The time for the 360 sweep can be any value from 3 seconds to 4 minutes, but
the rotation speed ( for best results ) should be constant, throughout the turn.
After completion of the sweep, ( switch = opened ) WinPlot
"figures out" the rotation rate and generates the plot. The polar plot ( necessarily )
assumes the antenna was rotated at a constant rate throughout the 360 turn, and the
start / end of the sweep occurred at the same compass heading. The start / end of the sweep
will be plotted at the 12 o'clock position of the display, regardless of the actual
compass heading of the antenna, at that moment. ( compass heading = you decide when you
use it )
Triggered SteadyScan Mode
The 2nd mode is called Triggered SteadyScan, intended ( mostly ) for
mast-mounted antennas that are rotated at a constant rate. In this mode, an extra input
( HEADING ) is provided, to detect when the antenna is facing the 12 o'clock
direction. ( user must provide this signal ) The antenna can be rotated through one or
more 360 degree scans, each scan being plotted by WinPlot when the scan is
completed... the HEADING input "triggers" the plot ( rising-edge trigger ) by
signaling the end of one scan and the start of the next scan.
In this mode the ENABLE input ( still required ) is only used
to start / stop the RS232 reporting, and enable the SquealTone output. The antenna
should still rotate at a steady rate, since WinPlot must assume this it true, to
generate the plot. The 12 o'clock position on the display corresponds to the antenna
bearing when the HEADING input detects the ( rising-edge ) trigger. ( compass
heading = you decide when you use it )
The antenna must generate at least two HEADING triggers to generate
a plot, since one trigger is required to signal the start of a sweep, and the next trigger
signals the end of the same sweep. If a suitable "rotary joint" is provided for the
antenna's coaxial cable, the antenna can rotate constantly, and WinPlot will update
the display on the completion of each successive sweep... WinPlot can accumulate
data from one sweep while simultaneously analyzing and displaying the results of the
previous sweep.
TachScan Mode
The last mode is called TachScan, also for mast-mounted antennas.
This mode offers the greatest angular precision, using the TACH input, which must
be driven by a ( user-provided ) antenna rotation clock. ( a "tachometer" signal ) In
the other modes, the RS232 messages are transmitted at a constant rate, but in TachScan
mode, messages are "triggered" by the TACH signal. No TACH signal = no
RS232 messages. The TachScan mode actually allows a simpler DF to be constructed, since the antenna does not need to be rotated at a constant rate... the antenna can be rotated "by hand" ( if desired ) which eliminates the need for a motor drive.
The exact tachometer rate ( pulses per 360 scan ) is not critical, because
WinPlot will "figure out" the rate, based on how many messages were received between
successive HEADING triggers. The number of RS232 messages must be limited to a value
less than 40 per second, ( for WinPlot to "keep up" with the arriving data ) so three
wire straps are provided on the PicoPlot PC board to "prescale" the TACH
signal, in case the tach rate is too high. The straps allow prescaler ratios ranging from
1:1 up to 128:1, so the number of tach pulses required to trigger an RS232 message can range
from one tach pulse per message, up to 128 tach pulses per message.
Hunting Antenna Nulls
Some people prefer to hunt with antenna "nulls", instead of the "peaks" provided by the major lobe of an antenna. ( or they switch back and forth between the two methods, as required ) This is easily achieved with the PicoPlot DF, or more precisely, with the WinPlot display program.
The OPTIONS page of the WinPlot display program has a button provided to reverse the "polarity" of the RSSI data, for use with receivers that exhibit a negative RSSI coefficient. ( = RSSI voltage descends for ascending signal strength ) Although intended for use with negative co-efficient receivers, this feature can also be used to "reverse" the polarity of the RSSI data, so that nulls will print as peaks, ( and vice versa ) on the display.
SquealTone Details
The SquealTone output can directly drive a small speaker, and a trimpot
is provided to set the audio level. When DC power is applied, the Squealtone ( briefly ) "beeps"
at the lowest and highest available tone frequencies. Otherwise, The SquealTone is muted
unless the ENABLE switch is closed. ( all modes ) With some fairly simple circuit mods, receiver audio can me "mixed in" with the SquealTone audio, and the receiver audio will not be muted by the ENABLE switch.
The SquealTone is provided mostly for the benefit of Portable SteadyScan
operation, where a ( bulky ) display computer might not be practical. The SquealTone uses a "look-up"
table of data to translate the full range of allowed RSSI values into an audio tone with a very smooth
response curve that spans 3 octave of range. ( about 200 to 1600 Hz )
In the SelfTest or Portable SteadyScan modes, the SquealTone has
two available sensitivity ranges. ( X1 and X5 ) In these modes, the HEADING input is not ( otherwise )
employed, so it is used to selected the desired range. The regular SquealTone range ( HEADING
switch = open ) follows the RSSI level in one smooth ascent from 200 Hz to 1600 Hz, across the entire RSSI
input range. The "magnified" SquealTone range ( HEADING switch = closed ) is provided to enhance
the SquealTone sensitivity to very small RSSI changes.
When the magnified range is selected, the SquealTone RSSI sensitivity is increased
by a factor of five, and the audio sweeps across the 3 octaves of tone range not
once, but five complete times, as the RSSI ascends through all allowed RSSI values. Whenever the tone reaches the
end of one range, it "rolls over" ( or "under" ) and starts the next ( 3 octave ) range. For example, if the
RSSI is ascending, the SquealTone will suddenly switch from 1600 Hz down to 200 Hz, to continue the ascent
in the next ( higher ) 3-octave range. If the RSSI is descending, it will suddenly switch from 200 Hz to 1600 Hz,
to continue the descent in the next ( lower ) 3-octave range.
This sounds a bit odd at first, but with a little use, it becomes very easy to
interpet.... and it allows very weak antenna peaks and / or nulls to be DF'ed effectively. Assuming the RSSI signal
has 80 decibels range, ( which is a lot ) the magnified SquealTone feature will provide an entire octave of tone change
for ( approximately ) every 6 decibels of RSSI change.
Technical Description
The PicoPlot DF is essentially a specialized DVM ( digital voltmeter ) with
an RS232, IrDA and an audio output. Four opamps ( = one chip ) are used to provide a
high input impedance to the RSSI source, and to allow compensation for RSSI bias and gain.
The signal is DC coupled throughout the opamp stages, and some AC "roll-off" is provided
to limit the response to signals below 500 Hz.
Dual trimpots ( coarse and fine adjust ) are provided to set the RSSI bias
and gain values. ( 4 trimpots, total ) Two LEDs are used to set the trimpots. The MAX LED
turns "on" if the analog input signal rises above 95% of the maximum allowed RSSI value, and
the MIN LED turns "on" for inputs below 5% of the same value.
The SquealTone audio output is trimpot-adjustable, and can drive a small
speaker. The SquealTone feature employs a software "lookup table" to translate RSSI readings
into the corresponding audio tone, yielding a very smooth and useful response to RSSI
changes. ( assuming the receiver RSSI response follows a logarithmic curve ) For some modes, two
( user-selected ) sensitivity ranges are provided. More SquealTone information is provided
in the preceeding section. ( see above )
A PIC microcomputer ( type 16C773 ) is employed to perform the actual
RSSI measurement, generate and send the RSSI messages, create the SquealTone, and monitor the
status of the switch inputs. This chip has a 12-bit ADC. The PicoPlot DF actually measures
the RSSI signal to 14 bits of resolution, and reports the measurements to 13 bits
of resolution. ( 0000 to 8191 )
The extra precision is obtained using a DSP "trick" called dithering,
in which multiple ADC readings are performed and summed together. ( four ADC readings, for
each PicoPlot RSSI message ) Each successive ADC reading is "biased" with a slight amount
of "extra" DC that is added to the RSSI signal, at the ADC input. The "extra" DC is provided
by two digital outputs on the 773 chip, through resistors that are "weighted" to increase
the ADC input by a total amount less than one LSB.
As a result of this dithering process, the four successive ADC readings
can be summed together, yielding a level of precision that is 4 times greater than the
accuracy of a single reading, taken alone. In PicoPlot, one of these extra bits of resolution
is discarded, yielding a measurement with 13 bits of resolution, and generates an RS232
message that reports RSSI readings that range from 0000 to 8191.
The RS232 message is transmitted at 9600 baud, using 8N1 format, with
about 1 millisecond between characters to allow the host computer to "keep up" with
the data rate. ( for the benefit of really old computers ) Negative voltage for the
RS232 port is "robbed" from the host computer, by using the host RS232 TX output as
the source for -V.
Each DF message contains 6 characters, starting with ASCII "%"
character, followed by 4 digits of RSSI data, and terminated with an ASCII carriage return.
RSSI message values range from 0000 to 8192. Messages are not transmitted while the
ENABLE switch is open. Two "special" messages are also transmitted to signal
specific events, depending on the type of mode selected, and depending on the status
of the input switches. A "9900" message signals the start of one ( 360 degree ) antenna
scan and/or the end of the previous scan, and a "9800" message signals the end of data
transmission, whenever the ENABLE switch is opened.
WinPlot Principles
A lot of the "magic" of the PicoPlot / WinPlot combination is actually in the
WinPlot display program, which uses some fairly clever software "tricks" to assemble
a meaningful polar-plot display from the raw RSSI data. This section provides a brief
explanation of "how it works". The actual operation and features of the WinPlot
display are described ( in detail ) on the MORE INFO webpage for WinPlot, which
is available HERE.
The image below shows the WinPlot display. This particular pattern was generated by
the WinPlot TEST function, which uses computer-generated ( artificial ) data... not
RS232 data. ( this pattern is provided in WinPlot for learning / demonstration
purposes )

In normal PicoPlot / WinPlot operation, a directional antenna must be rotated
through a complete 360 degree turn, to generate a display. For reasons of simplicity
and economy, the WinPlot display is not calibrated in either the azimuth direction
( degrees ) or the radial direction, ( decibels ) but it can still be interpreted
in a very meaningful and useful way, with some user co-operation.
The azimuth scale ( degrees ) is calibrated in "relative" degrees : The 12 o'clock
position on the WinPlot display corresponds to the start / end of each 360 degree
sweep. ( compass direction = you decide when you use it ) The azimuth scale
precision and accuracy depends mostly on the user... WinPlot basically "figures out"
where the RSSI readings should be plotted, based on some assumptions that require
co-operation from the user. WinPlot assumes the antenna is rotated through a
complete 360 degree sweep... no more, no less. It also assumes the antenna is
rotated at a steady speed, throughout the turn. ( hence the term SteadyScan )
The elapsed time for each 360 sweep is not critical, and can vary from 3 seconds
to 4 minutes. WinPlot "figures out" the rotation rate, ( after each scan is
completed ) based on how many RSSI messages were received during the 360 sweep, and
then uses this information to compress or expand the available RSSI data into a
360 degree polar-plot display. If more than one RSSI reading corresponds to a
particular one-degree ( display ) sector, the multiple RSSI readings are averaged
together, automatically.
In reality, some variation of the 360 start / stop heading detection ( and antenna
rotation speed ) can be tolerated without developing significant errors in the
polar-plot display. A little practice ( by the user ) can also improve the precision
to a high degree. In the TachScan mode, a constant rotation speed is not important
at all, ( and can vary considerably ) since the RSSI messages are basically
"clocked out" of the PicoPlot DF, by the ( user-provided ) TACH signal. Therefore, the antenna can be rotated "manually", ( if desired ) with no motor drive. ( but only rotated in one direction... no "backing up", please... )
The radial scale ( decibels ) "auto-ranges" automatically when each sweep is
completed, so that the available RSSI data always "fills the screen". This
eliminates any low-quality display plots ( too big or too small to view ) that
might otherwise occur, due to variations of signal strength, ( strong / weak
signals ) or poor directivity / gain in the DF antenna. Numeric readouts at
the top / left corner of the WinPlot display show the maximum, minimum and
average RSSI readings, if this information is desired.
As a result of this "auto-ranging" of RSSI data, the radial direction of the
display is not truly calibrated in decibels, ( or any other specific unit of
measure ) but otherwise provides a good "relative" indication of signal strength
versus signal direction. It also ( effectively ) "magnifies" the directivity of
the antenna, to fill the screen with a useful display, so that even antennas
with poor directivity will yield a plot that has a significant ( and obvious )
major lobe. ( or null )
The WinPlot display ( therefore ) is fully "adaptive", for both RSSI data and
antenna rotation speeds, and will automatically adjust itself to the available
RSSI data, to fill the screen with a useful polar-plot display.
Warnings and Caveats
The PicoPlot DF is NOT suitable for a technical "beginner". Most
receivers do NOT provide an RSSI output and therefore will require some ( non-trivial )
internal modifications to provide this signal. In some cases, these modifications may be
impractical or impossible, and will require the use of a different receiver... a lot of
the radios available today are simply "too tiny" to safely permit someone "tinkering around"
inside, looking for an analog RSSI signal. If you are not confident about your ability to do this, probably you should NOT attempt it, and should not buy a PicoPlot DF. ( or else get some serious technical help from a friend )
It is the users responsibility to identify and perform the required mods
to obtain a suitable RSSI signal, there are simply too many different receiver designs to
provide a detailed description for each receiver, here. The user must also perform a
( one-time ) calibration procedure with the trimpots on the PicoPlot PC board, to
compensate for RSSI bias and gain values, which will vary depending on the type of receiver
employed. The calibration procedure ( and specific RSSI requirements ) are described on
the COMPLETION INFO webpage, available HERE.
If you are an experienced DF hunter already, the PicoPlot DF
probably won't make you a significantly better hunter. ( but it will help ) PicoPlot essentially provides
a new ( visual ) way to interpret data obtained by an old ( and venerated... and reliable ) DF method. For
those with less experience or skill, it should make a bigger difference, and also serve
to demonstrate ( visually ) the concepts of beam sidelobes and nulls, as well as the
effects of signal reflections.
For initial beam readings at the start of a hunt, it probably is very
worthwhile, and in situations with lots of multipath and reflections that can ( otherwise )
be confusing to interpret without a visual display. Hunts in which the transmitter is
deliberately fluctuating the power level ( to evade hunters ) will also benefit due to
some of the "averaging" features of the WinPlot display program.
Base station DF readings should benefit a good deal, and mobile rotating
antennas will also significantly benefit, especially if the antenna is constantly rotating,
since the WinPlot display program will automatically "update" the display on
completion of each successive antenna scan.
Unusual DF Systems
Spectrum Analyzers
The PicoPlot DF is intended for use with a radio reciever that
provides an RSSI analog output, but it can also be employed with most ( general - purpose )
RF spectrum analyzers, yielding a very agile and flexible DF. Essentially, any signal that can be observed on the spectrum analyzer can be DF'ed using the PicoPlot, with a few "trick" control settings on the analyzer.
Most analyzers provide a video
output that can drive the RSSI input of the PicoPlot DF. By setting the analyzer
center frequency to the desired DF frequency, and then setting the "span" to zero, ( also
called "dispersion" or "sweep width" ) the analyzer essentially becomes a single-channel "reciever" that drives a video display, instead of a speaker. When used in this manner, the horizontal axis is no longer calibrated in units of frequency, ( KHz ) but in units of time, ( millisec ) and the vertical axis is ( still ) calibrated in decibels. The video output signal ( therefore ) becomes an "RSSI" signal, suitable for driving the PicoPlot DF input.
Aircraft Installations
Another potential application involves small aircraft, with a "fixed" antenna. In this case, the antenna can be rotated by rotating the entire aircraft... fly in a circle, at a constant turn rate. Fixed antennas will ( with very few exceptions ) always exhibit some significant degree of "directional" behavior... this is rarely obvious to the user, but it can be exploited with the PicoPlot DF, using the Portable SteadyScan mode. A pre-existing antenna ( already installed ) can therefore be employed, if a test flight is performed to identify the antenna pattern. ( specifically, the direction to the major lobe, compared to aircraft heading )
The remaining equipment ( reciever, display computer and PicoPlot DF ) can be assembled into a portable package that can be installed and removed "at will", and therefore would not require FAA approval. ( but not nearly as convenient as a panel instrument ) The user would have to provide a way to ( temporarily ) connect the antenna to the DF reciever. ( a comparatively simple task ) As an alternative, a dedicated antenna can be installed on the aircraft, and routed to a BNC jack at the instrument panel, to provide this feature.( an FAA 337 form would probably cover this modification )
"Scanning Yagi" DFs
The Triggered SteadyScan and TachScan modes are capable of handling constant antenna rotation, ( along with the WinPlot display program ) which would allow constant and ( almost ) real-time updates of the display. This would require a motor-driven antenna ( mast-mounted ) but it also would require a "rotary RF joint" to couple the RF signal from the ( rotating ) antenna to the ( stationary ) reciever.
This isn't as hard as it sounds, since most co-axial RF connectors are, well... "co-axial", and therefore already have the geometry required for a rotating RF joint. It is mostly a matter of defeating the "locking mechanism" of the connector ( whatever it is ) by physically altering the connector. ( grind away or cut away the locking shroud on a type-N connector, for example )
Pack the connector with some lubricant to reduce wear, and immobilize any metal flakes that will wear off, in normal use. Provide some light compression ( a weak spring ) to keep the two halves of the connector mated together reliably, ( use your imagination... ) and firmly mount only ONE of the two mated connectors.. allow the other one to "float free" so perfect centerline alignment of the two connectors is not necessary. ( reduces the wear on the connector contacts )
Some years ago, ( long before the PicoPlot was created ) I did this myself ( Bob Simmons ) using type-N connectors, and a spectrum analyzer for the reciever, as described above. I found the ( resulting ) rotary joint to be effective and reliable. Obviously, there are several different ways to do this, and a lot of other details to work out, like how to provide and connect a motor drive, provide a mobile mount, etc. but that is what human imagination is for, yes ? In my case, I used an abandoned nautical radar pedestal... discarded the parabolic dish, installed a mast with a 3-element Yagi, and the N-type rotary joint... and I was off and running. ( some details omitted for clarity... ask, if curious )
If a small Yagi is employed with such an arrangement, the resulting DF will exhibit almost all the "speed" and "simplicity" virtues of a Doppler DF, ( = constant and automatic display updates ) coupled with the "gain" and "directivity" virtues of a genuine Yagi... really, the best of both worlds.
Much smaller antennas ( with less gain and directivity ) could also be used, to greatly simplify the mechanical aspects of such a DF... a modest "dipole" made with some ( small ) rubber duck antennas ( or simple wire elements ) would yield a MUCH smaller antenna, which could be rotated with a tiny motor. ( or even "by hand", if a tach sensor is provided ) The RF sensitivity ( and therefore range ) would suffer as a result of the small antenna size, but it would otherwise be much easier to construct, install and remove on a vehicle.
Acknowledgements
I want to thank the following people for their encouragement, patience, suggestions and especially their technical feedback, provided during the creation process for the PicoPlot DF. Without their assistance, it wouldn't be the slick instrument it is, and ( indeed ) might not exist at all.
		Doug Hutchison, GM7SVK
		Alan Marconett, KM6VV
		Chris Casey, M1EEV
		Tom Sneden, K6VCR
More Information
If more information is desired about the PicoPlot DF, or for any other inquiries, please send an e-mail directly to me :
Bob Simmons / WB6EYV.
